Tables
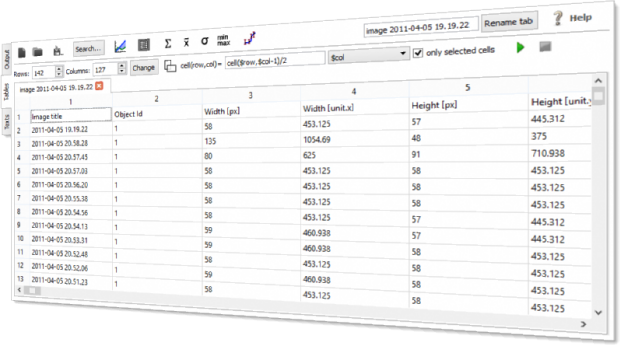
The table section is your workspace to edit, analyze, and visualize data. It houses an Excel-like spreadsheet, statistical analysis capabilities, and plotting options. Main functions:
- Apply mathematical functions to rows and columns
- Determine statistical values
- Find correlations
- Create plots
- Convert raw data into images
Math
Apply mathematical formulas and expressions to rows and columns.

Statistics
Analyze your data and calculate statistical metrics such as standard deviation, extreme values, and more.

Correlations
Evaluate your data automatically for correlations and get a first impression of functional dependencies.

Plots
Select a selection of cells and create extensive graphs with linear or logarithmic scaling, error bars, legends, and more.
Conversion of data into images
Select table regions to convert values to a z-matrix and hence to an image.