Beside the common handling functions of the other pages like open, save, export, search and replace, the tables page provides extensive spreadsheet functions.
Read on for further details:
To create a new table, specify the numbers of rows and columns click onto the "New table" button.![]()

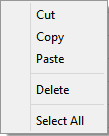
For cut, copy, paste, delete and select options, use the right click menu.
Click on the "Search" button to search and replace elements in the current table.
![]()
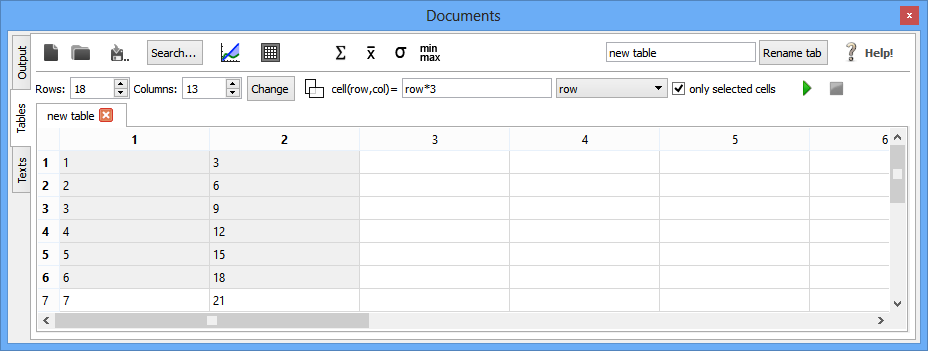
Use the tables page to work with your data. After creation of your customized table, apply formulas and calculate significant statistical values.
Data displayed in tables can be sorted by clicking on a column header. Dependent on the amount of mouse clicks, the data is sorted ascending and descending alternately. The entire table is sorted in respect to the column where the click ensued.
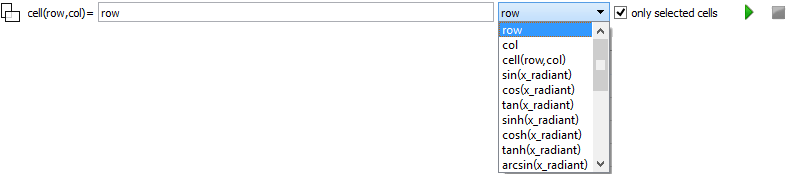
The formula input panel "cell(row,col)=" enables you to process complicated calculations. Insert a formula and use some of the default functions if necessary. Select if your formula should be applied to selected cells only or to all cells and press "play".
See two examples below:
Fill a column with its row numbers
To fill a column with its row numbers, select empty cells and insert the formula:
cell(row,col) = $row
in the formula panel and press "play". Every variable or function has to get a "$" sign as an escape sign.
The cells will be filled with the values: 1, 2, 3, ...
To multiply a column filled with its row numbers by a factor of "3", select empty cells to the right of the origin column and insert the formula:
cell(row,col) = cell($row, $col-1)*3
in the formula panel and press "play".
The origin column contains the values: 1, 2, 3, ...
and the results are: 3, 6, 9, ...
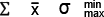
On table page you are able to calculate statistical values easy and fast. Just click on the applicable button. The results are displayed on the output page.
Available functions are:
The "Find correlations" functions helps looking for dependencies within your table data. The algorithm calculates the formula, determines errors and creates plotable data of the appoximated functions.
To find correlations, proceed as follows:

Mark at least two columns and click on the "Plot" button. A plot dialog opens and enables you to define your own plot settings. For further details see the "Two dimensional plots" section in the plotting chapter.

Each table might be converted to a z matrix. Therefore, mark the requested table data cells and click on the "Create image from selected cells" button. An image is created consisting of the selected table data as the z matrix.
