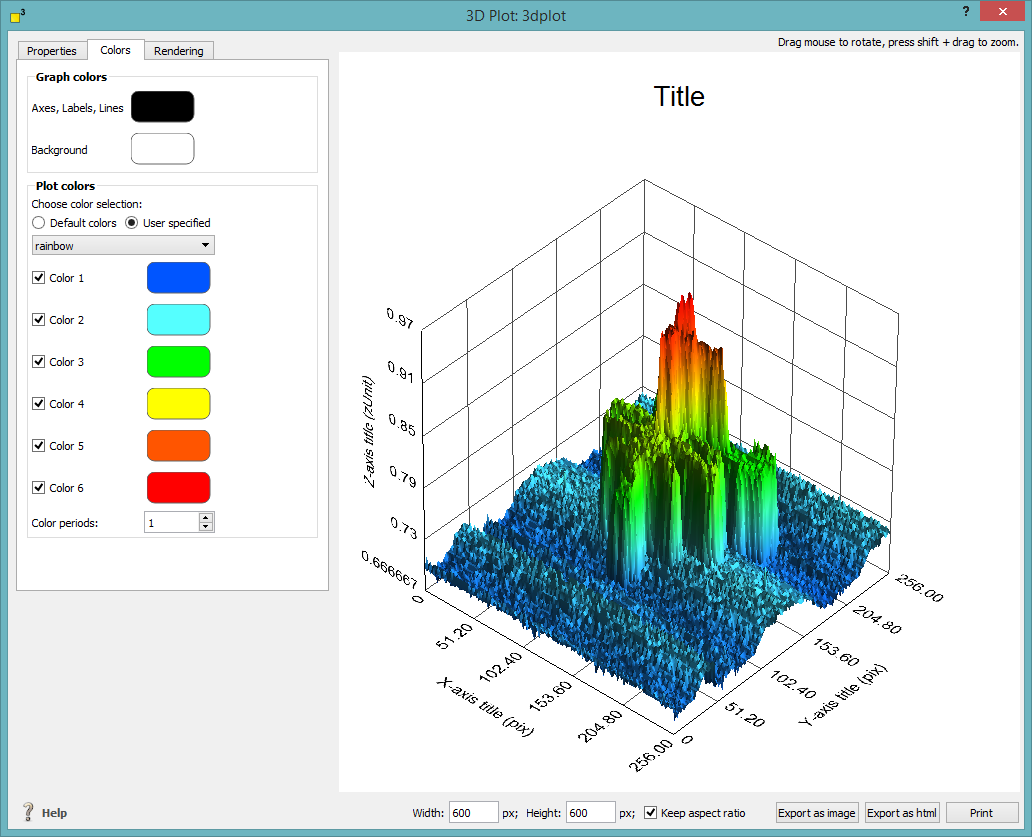
The major control elements for creating 3d plots are in a tabulator view with pages for properties, colors and rendering. The control elements for export and printing of the existing plots are located at the bottom of the window.
Create three dimensional plots
![]() offers extensive three dimensional drawing options. To simplify the creation of these plots,
offers extensive three dimensional drawing options. To simplify the creation of these plots, ![]() provides a lot of default settings. All options are neatly arranged on three pages which are explained in the following: properties, colors and rendering.
provides a lot of default settings. All options are neatly arranged on three pages which are explained in the following: properties, colors and rendering.
The properties page consists of an "Axis and titles" and a "Scaling" section.
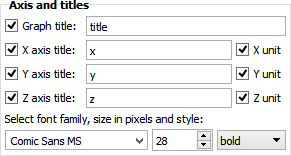
In the "Axis and titles" section you choose the titles and labels of your graph and all axes. Check or uncheck each label to customize your graph. You might add units automatically to the axes labels by checking the unit checkboxes. Select the font family, its size and style of all graph descriptions.
The axes labels and their style are set in the "Scaling" section.
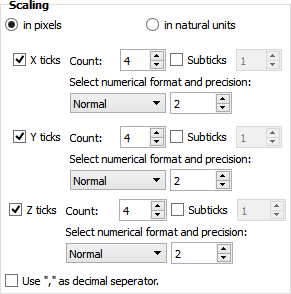
At the top choose if you would like to display the axes values in pixels or natural units. Select which axes ![]() should create and how many ticks and subticks should be drawn. For each axis the numerical style (normal: "1.2345" and scientific: "1.23×1045 ") and the precision of the tick labels. Depending on your local settings, choose the decimal separator.
should create and how many ticks and subticks should be drawn. For each axis the numerical style (normal: "1.2345" and scientific: "1.23×1045 ") and the precision of the tick labels. Depending on your local settings, choose the decimal separator.
The colors of your three dimensional plot are set on the "color" page. In the upper section you select the colors of axes, labels and lines as well as the colors for the background.
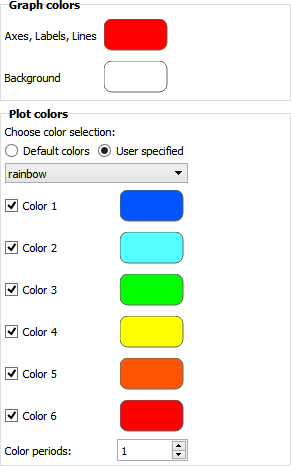
The colors for representing the data are displayed in the section "Plot colors". First, you have to choose if you would like to transfer the color scheme from the origin SciImage. If you decide to use self-specified colors you might select one of our default color schemes or pick up to six colors on your own. You may use less than six colors. In this case, uncheck the unnecessary colors.
The option at the bottom of this section helps you to use more than six colors in your plot. The number of color periods describes the number of iterations how often the above selected colors reoccur in your color scale.
The rendering page contains all the settings which emphasize the three dimensional experience of your plot. it consists of the "Data precision and render mode" section, the "Lighting" section and the "View" section.
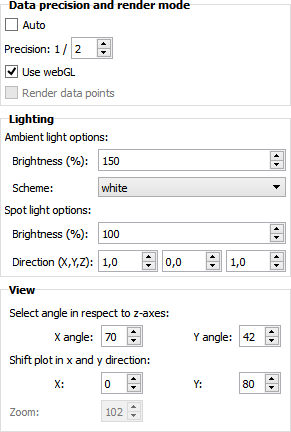
Data precision and render mode
The first section "Data precision and render mode" sets the options in respect to your hardware layout. Depending on your computational system and its graphics equipment you should decrease the number of evaluated data points.
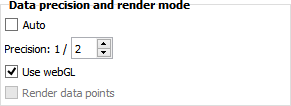
If the default setting "Auto" is activated, ![]() limits the number of evaluated data points to 14400 points. If you decide to vary this data limit, you might uncheck the "Auto" option and select your favorite precision. A precision of 1/2 means every second data point will be drawn, 1/3 every third and so forth.
limits the number of evaluated data points to 14400 points. If you decide to vary this data limit, you might uncheck the "Auto" option and select your favorite precision. A precision of 1/2 means every second data point will be drawn, 1/3 every third and so forth.
If your web browser support webGL you should check this option. WebGL enables smoother handling and significant better drawing of the three dimensional plots. Only if no webGL is available, you might select the rendering of each data point depending on the power of your hardware.
Similar to openGL options, webGL offers extensive lighting options. We have to distinguish between two kinds of light sources: the ambient light and the spot light.
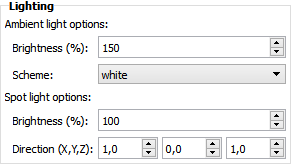
The ambient light is a diffuse light source and provides a background lighting comparable to the sun light. You might select up to 1000% of brightness and chose a favored ambient light scheme. Four default light schemes are avavilable.
Ambient light scheme |
Description |
white |
All fraction of primary colors are equally distributed. |
sunlight |
The light drifts slightly into the yellow similar to the natural sunlight. |
warm |
All colors are slightly shifted into the red region. |
cold |
All colors are slightly shifted into the blue region. |
The spot light is a directional light source comparable to a huge spotlight and enhances structural differences on the surface. The brightness is adjustable (up to 1000%) as well as the spot direction. The spot direction vector is normalized to the length of the axes. Try different directional settings to emboss any special surface feature you like.
Customize the appearance of your three dimensional plot by selecting your favorite perspective.
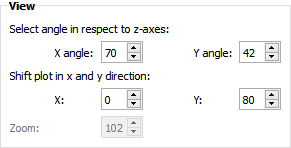
You might rotate your plot by selecting different angles, shift the plot in x- and y-direction as well as define a default zoom factor. All settings are default settings. You may vary these values at any time by your mouse controls.
Mouse and keyboard commands |
Description |
Click and rotate |
Rotate the plot in three dimensions. |
Press "shift" and drag. |
Zoom in or out. |
Export three dimensional plots
![]() offers several possibilities to store and export your plots. It is possible to create images files, html files as well as pdf documents. For posterior analysis the plots can be stored in the
offers several possibilities to store and export your plots. It is possible to create images files, html files as well as pdf documents. For posterior analysis the plots can be stored in the ![]() file format.
file format.

Before exporting your data as an image or pdf file or before printing, you should specify the dimensions of your plot. Select your favorite dimensions in pixels and check or uncheck the "Keep aspect ratio" to avoid unwanted stretching of your plot.

Export as an image file or pdf document
Specify your favored image dimensions and click on the "Export as image" button to export your plot as an image file or pdf document. ![]() supports the file formats png, jpg and pdf.
supports the file formats png, jpg and pdf.
With ![]() it is fast and simple to create html source code for a web site. Click on the "Export as html" button and select a folder. Inside this folder, the main html file will be created along with several sub folders containing associated javascript and css documents.
it is fast and simple to create html source code for a web site. Click on the "Export as html" button and select a folder. Inside this folder, the main html file will be created along with several sub folders containing associated javascript and css documents.
Print your three dimensional plots
Printing your plots with ![]() is really easy. Specify the image dimensions and click on the "Print" button. In the print dialog window, you are able to select your printer with all its settings.
is really easy. Specify the image dimensions and click on the "Print" button. In the print dialog window, you are able to select your printer with all its settings.