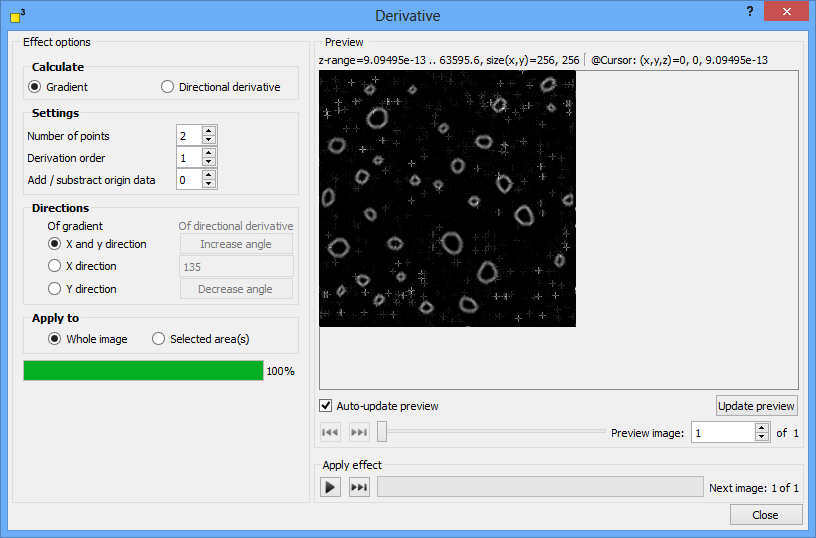
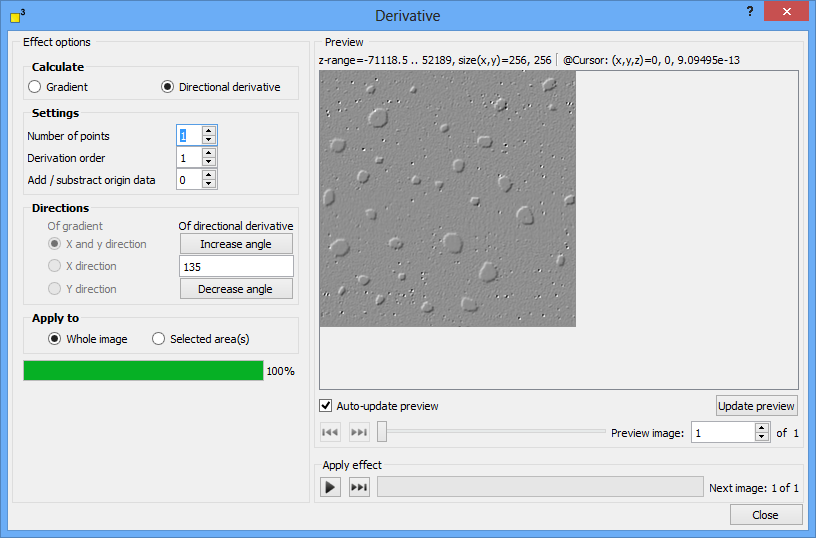
The derivative function offers two complimentary derive functions - gradient and directional derivative. The gradient derivative creates a vector field pointing into the direction of the largest slope. Its length is plotted in the processed image. The directional derivative visualize the slope in one or more directions. As a consequence it creates a visual shading of structures and emphasizes structural features.
Read on for detailed explanation about:


DotCube provides two derive functions: gradient and directional derivative. The gradient derivative creates a vector field pointing into the direction of the largest slope. Its length is plotted in the processed image. The directional derivative visualize the slope in one or more directions. As a consequence it creates a visual shading of structures and emphasizes structural features. Select the applicable option in the "Calculate" group box.
The derive settings options are shown in the table below:
Option |
Description |
Number of points |
Number of neighboring points which contribute to the calculation. |
Derivation order |
Number of consecutive derivations. |
Add / subtract origin data |
The origin data multiplied with this factor is added to the processed image. |
Note: If the number of points is increased, the features in the processed image are more emphasized and measurement noise will be reduced, but the processed image loses its sharpness.
For the gradient calculations, the x and y direction as well as both are available. For the directional derive calculation, any angle with a step size of 45° is selectable.
Choose the region where the derive functions should be applied: to the entire image or to a previous marked area. Select the applicable option.
The execution of the function may be started by pressing two different shortcut keys:
For more shortcut keys see our detailed list.