The line scan tool performs a definable cut through an image region. Click on the image and move the mouse to draw a line along the features of your interest. On mouse release, the z values may be plotted or tabularized.
Read on for further explanation:
The line scan function displays the results as a tabular view, a two dimensional plot and / or labels drawn on the image.
If your data format contains natural units, the output in the x direction unit is available by selecting the "use [Unit.x] for plot and table output" option.
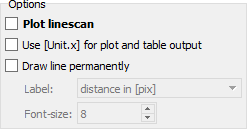
dotCube provides the cut data output as a tabular view and optional as a two dimensional plot. Therefore, select the "Plot line scan" option.
The line scan data is always displayed in the tabular view. If you prefer natural units, select the "use [Unit.x]for plot and table output" option. The unit preset will be applied to the two dimensional plot, too.
Each line scan is logged in the output tabulator view. It contains the image name, the measured total distance in pixel and the x and y vector length in both units: pixels and natural units. The log dialog allows to print and log the logged data.
If you want to label your line scan, activate the "Draw line permanently" option. You might also add a text label to the line scan. Therefore, select the applicable option ("distance in pix", "distance in x with or without unit label"). The text labels are drawn only if the "Draw line permanently" option is selected.
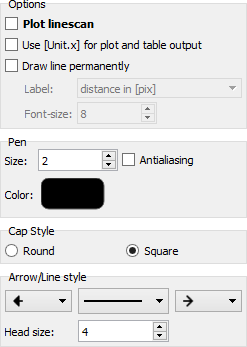
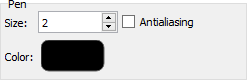
Select the pen size, anti-aliasing and color options in the pen group box:
The cap style can be modified in the cap style section:
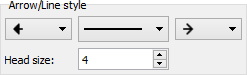
The line ends and arrow styles are set in the arrow / line style group box: